
After winning the Bundesliga for the fourteenth (14th) year in a row, by a total of 12 points, I wanted to see how dominant we’d become over the course of this season to get a sense of how far ahead of the rest of the league we are. Sure the points difference tells a story, but it’s a simplified one.
There are a few possible explanations for that dominance: are we blowing teams away with our creative players and efficient strikers, or are we reliant on a great defence and ‘keeper? Do we have a big home bias, or, is it simply the case that FM26 is too easy? I was largely motivated to test these theories out by some of the excellent data analysis charts that Christina has been sharing on Bluesky.
Non-Penalty xG Differential & Home Bias
The first graphic below demonstrates the frequency of how often we were outperforming teams (or not) by npxGD (non-penalty expected goal difference). Penalties (and own goals) are stripped out because they skew the data, given the 75% probability of a goal being scored from the penalty spot.
When the markers appear above or below the upper and lower quartiles I’ve coloured home games as red, and away as light blue to help identify the existence of any home advantage. The markers are laid out in the order the games were played in over the season to provide analysis of any potential trends, such as a hot streak.
You can see instantly that we have been very creative and had a relatively mean defence against some teams at home, judging by npxGD. This indicates that there is at least some bias towards our home form over that of our away games. In fact, only the away match against Kaiserslautern, the seventh game of the season, saw us register over the upper quartile range of npxGD.
Our early season form was a little patchy judging by npxGD, if you ignore the first game against Hoffenheim, which saw us achieve a npxGD of 4.23 to their 0 (a game which finished just 2-0). The next five games saw us average just 0.44 npxGD. The other games over this period weren’t especially difficult fixtures by their end of season placing, with Borussia Dortmund (4th) and VfL Wolfsburg (5th) being the only two teams to finish inside the top ten.
That perhaps points to a need to look at who we play in pre-season to better prepare our players for the readiness required for the start of the season.
After that, though, we hit our straps and started creating and preventing a plethora of chances well above that of our opposition consistently.
From game weeks 7–13 we finished each fixture with a npxGD over our median for the season. However, this peak is not sustained, and we revert to a range of between 0–2 npxGD, except for the away fixture against RB Leipzig. This saw only our second negative npxGD game, with only one more to come towards the end of the season, when the Bundesliga had already been won, away against FC Bayern (a 0-0 draw).
After looking into the data again, I calculated the average for home and away fixtures for npxGD — 1.98–0.77, which couldn’t be clearer that we have a strong home bias towards our Bundesliga results. This is something I need to take into consideration when contemplating tactics and approach to away games. A positive 0.77 npxGD is still good, but it does say that we can’t dominate teams as much as we do at home.
The npxGD across all fixtures, in order played but split between home and away fixtures, are expressed graphically below:

It’s further evidence that we’re fantastic at picking teams apart at home, which perhaps could be a chance to give more minutes to the younger players in my squad that need minutes to help them develop, particularly against weaker opponents.
To gain a greater perspective, I wanted to draw some comparison to real life, so I looked into the npxGD Liverpool achieved in the 2024-25 season, in which they dominated the Premier League on a simple points metric. Liverpool finished with 44.8 npxGD across 38 games, compared to our 45.32 over 34 games, giving mean averages of 1.18 and1.33 per game, respectively. On that basis, we were dominant, but as we’ve just realised, so much of this was down to our home form.
Efficient in attack or a big bully?
To understand whether we were simply dominating weaker sides or also performing strongly against top teams, I summed the non-penalty xG from both home and away fixtures for each opponent (shown by the orange columns), alongside the summed npxGD (shown by the blue columns). This allows us to see clearly who we performed well against — and who caused us more problems.

As this chart neatly indicates, there is something of a positive correlation (see the orange trend line) between the sum of the npxG and the final league position of the opponent. So far, so expected. Again, though, there are notable outliers across the two games – Borussia Mönchengladbach (them again), and Mainz 05. Both teams in the bottom half, with Mainz 05 just outside the relegation play-offs. The games against Kaiserslautern also skewed the data, but more because created so much against them – nearly eight expected goals against two goals.
If you look at the blue trend line, this also shows a positive, and stronger, correlation between the oppositions finishing place and our npxGD against them.
Digging further still, I’ve broken the results down into a simple table:

The 22.04 npxGD differential only further emphasises our home bias, but what was most surprising here is the extent to which we weren’t dominating the weaker teams, bar the obvious outlier of Kaiserslautern. If we take the bottom half of the Bundesliga, we had a total of 20.74 npxGD at home, an average of 2.30 per game. This compared to just 7.57 (0.84 average) away from home. This is great for considering squad rotation for home games, keeping players fit in and amongst those all important Champions League fixtures.
Against teams in the top half, the total npxGD at home was 12.94 (1.62 per game) against 4.07 (0.51 per game) away from home. We must take the top teams seriously away from home at all costs.
As the season played out, we regularly overachieved our non-penalty expected goal output (see chart below).

Defensive brilliance?
Here you can see a box and whisker chart to analyse our opponents attacking outcomes against their expected outcomes (npGA – npxGA).

Broadly, opponents scored below the expected level, as the box plot is negative in its entirety, meaning opponents consistently underperformed against their expected goal output. This represents 50% of the entire range of games played, where we see opponents score between -0.08 and -0.58 less than they should. The median indicates that a typical game would see us concede -0.325 non-penalty goals less than what is expected, with a very similar mean of -0.31, indicating a balanced distribution. Effectively, the outliers aren’t skewing the data to dominate the average.
For the ‘whiskers’ (the lines coming out of the box plot), the range stretches now from ~-1.32–~0.66. Any opponent under or over performance within this range are described as ‘non-outliers’.
As you can see, on just three occasions, our opponents had better than expected levels of scoring, and the same applies for three opponents underperforming their expected number of goals by a degree enough for it to be an outlier.
The ‘unlucky’, or perhaps poor, shooting at our goal was seen in away fixtures to FC Bayern (-1.62 npGA-npxGA), Schalke 04 (-1.58) and Borussia Mönchengladbach (-1.45). This identifies the FC Bayern away game again. We played a depleted side, notably in midfield, and had to weather a number of shots and employ some individual instructions to closely mark their influential players in order to attempt to limit their creativity after they had established a dominance. All in, we conceded 10.53 goals fewer than we were supposed to over the season.

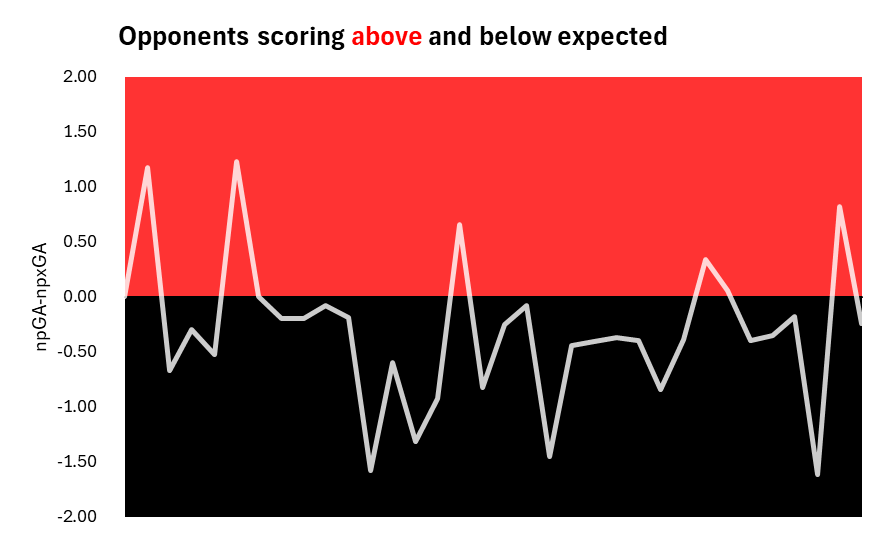
Looking at the opponents scoring above and below their expected rate of scoring is indicative of our defensive skills given the frequency with which teams are scoring fewer goals than expected, but also because of how few chances and goals per game we conceded. (I was hoping to do this for all teams for the entire season but only after I had the idea after seeing a similar graphic from Christina here and FM being FM, it doesn’t keep the data logs of the games that the human manager didn’t manage in that far back, so it’s something I’ll have to look at again and log it game week by game week).
This graphic though is a better indicator of luck. We were, to an extent, unlucky to concede the goals we did when the opposition created little with the two peaks early in the season.
At the same time, the troughs are the occasions where our opponents were unlucky – the Schalke 04, Borussia Mönchengladbach and the FC Bayern games (stated in order in which they were played). Yet if you look more closely at the period when we played those Schalke 04 and Borussia Mönchengladbach matches, we had been having a run of good fortune in terms of our opponents misfiring.
Conclusion
To evaluate, our success over the course of the season clearly wasn’t luck – we finished first comfortably. Our average npxGD at home is remarkable across the season, and we’re still well above a zero npxGD away from home too. This is still worth an investigation next season, though.
One possible explanation is perhaps because teams are setting up in a deep block and are more cautious away from home is inviting us onto them enabling us to create more chances? I’ll need to have a deeper look at the correlation between the formations and playing styles of the opposition managers and the npxGD as the season progresses that I can try to identify patterns and adjust accordingly. Knowing which set-ups we struggle against could be really helpful to identify what approach we should take to the game and be reflective, if a little reactive. I have already spotted that certain players seem to be successful in creating shot actions against us with some regularity. It will be a case of trying to minimise these, and cut them off at source if possible
I’ve already made changes to our squad ready for the new season. I won’t be sending some players out on loan if I deem them too good enough for the first-team squad as their development is sufficiently complete.
As a direct result, I’ve identified one tactical change that I’m keen to make and have been looking at in pre-season. I’ve switched the right full-back to a playmaking wingback, the right-sided central midfield to a wide midfielder to give balance outwide, and the striker to a centre forward rather than a deeplying forward. I’m keen to see what balance this gives us, and early indications, against albeit weak opposition, is encouraging.

PakarPBN
A Private Blog Network (PBN) is a collection of websites that are controlled by a single individual or organization and used primarily to build backlinks to a “money site” in order to influence its ranking in search engines such as Google. The core idea behind a PBN is based on the importance of backlinks in Google’s ranking algorithm. Since Google views backlinks as signals of authority and trust, some website owners attempt to artificially create these signals through a controlled network of sites.
In a typical PBN setup, the owner acquires expired or aged domains that already have existing authority, backlinks, and history. These domains are rebuilt with new content and hosted separately, often using different IP addresses, hosting providers, themes, and ownership details to make them appear unrelated. Within the content published on these sites, links are strategically placed that point to the main website the owner wants to rank higher. By doing this, the owner attempts to pass link equity (also known as “link juice”) from the PBN sites to the target website.
The purpose of a PBN is to give the impression that the target website is naturally earning links from multiple independent sources. If done effectively, this can temporarily improve keyword rankings, increase organic visibility, and drive more traffic from search results.
Streaming Film
Nonton Film gratis
Jasa Backlink
Download Anime Batch